The latest update release of PLANERGY went live over the weekend of the 15th/16th of February. See below the updates made in the latest release.
What’s New
API
Our API is now available to be used for custom integrations. We already integrate with many of the leading ERP and accounting software but if we don’t have an existing integration with your other existing software already this could be the opportunity to link PLANERGY with your other tools using our API. Create a support ticket by using the support button on the left of the screen when logged into PLANERGY, if you need help with a specific integration.
Improved Graph Reports
The graphical reports, mostly available in the Advanced Reporting section of PLANERGY, have received some updates to improve your ability to report and gain actionable insight from the system.
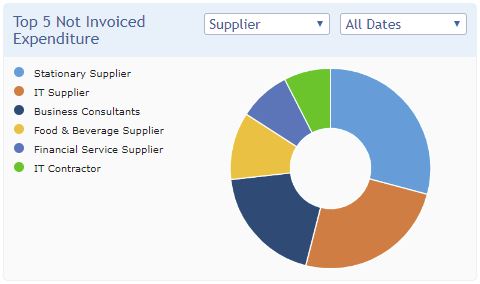
Top 5 Not Invoiced Expenditure
There is a new ‘Top 5 Not Invoiced Expenditure’ donut chart to give you the ability to report on committed spend visually. Report on Category, Cost Code, Department, Item, Location, Supplier, and User. Donut charts also have a new filter for date range to add additional flexibility.
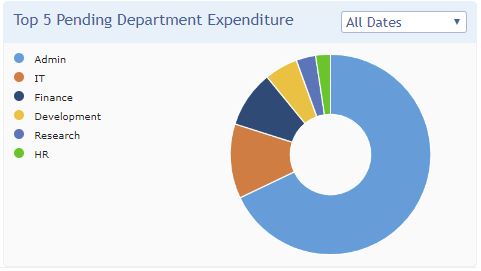
Top 5 Pending Department Expenditure
There is a new ‘Top 5 Pending Department Expenditure’ donut chart allowing you to report on where the expenditure pending approval is assigned per department. This also includes the ability to filter by the date range of the request.
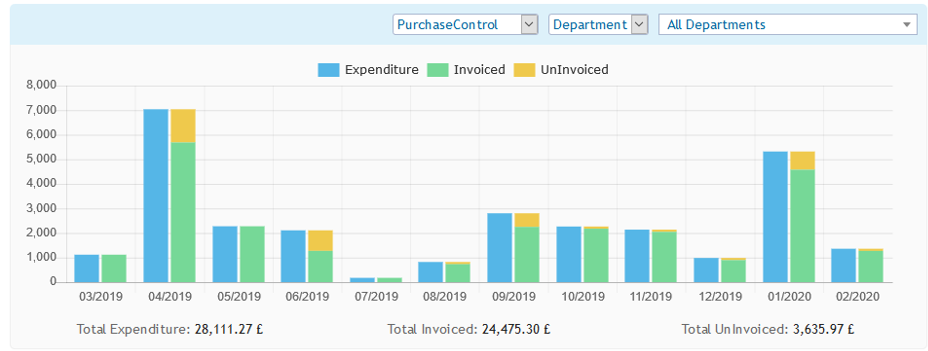
Expenditure and Invoiced Bar Chart
A whole new filterable Expenditure bar chart ‘Expenditure and Invoiced Bar Chart’ has been added to Reports & Searches > Advanced Reporting > Expenditure reports list. Report on the invoiced status of orders by month. See committed expenditure, the value already invoiced, and the remaining uninvoiced values. Data is filterable as needed by Location, Department, User, and much more.
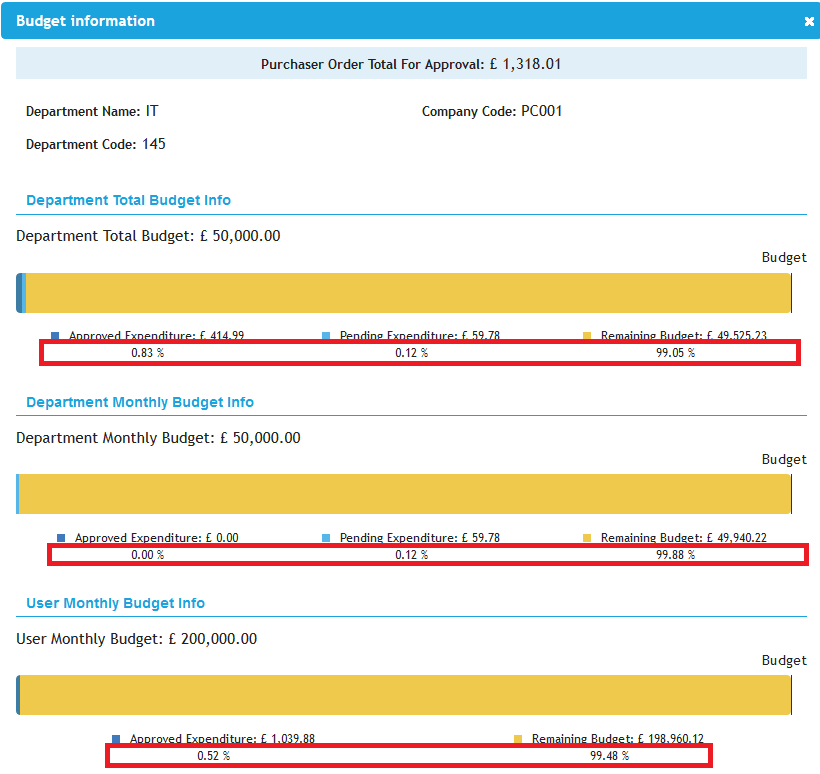
Check Budgets Graph
The check budget graphs now also include percentage values to give you a better understanding of how much of the budget has been used and how much is still available.
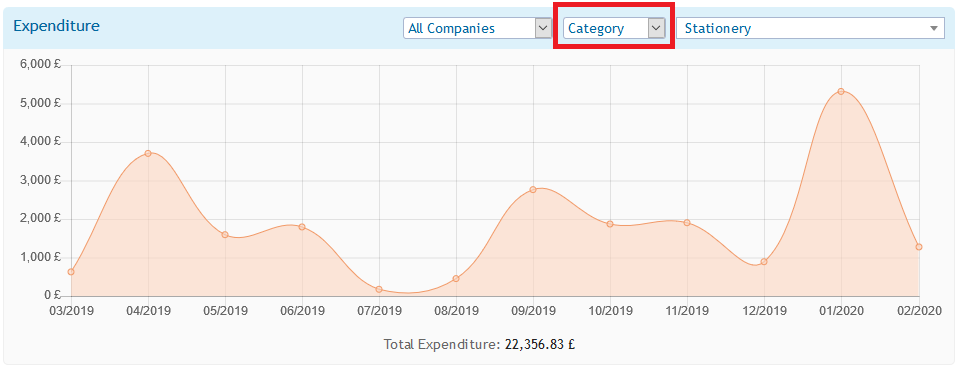
Expenditure Line Graph Update
The ‘Expenditure’ line graph showing expenditure for the previous 12 months has been updated. Previously you could report by Department only. It is now also possible to report by Cost Code, User, Supplier, Item, Location, and Category.
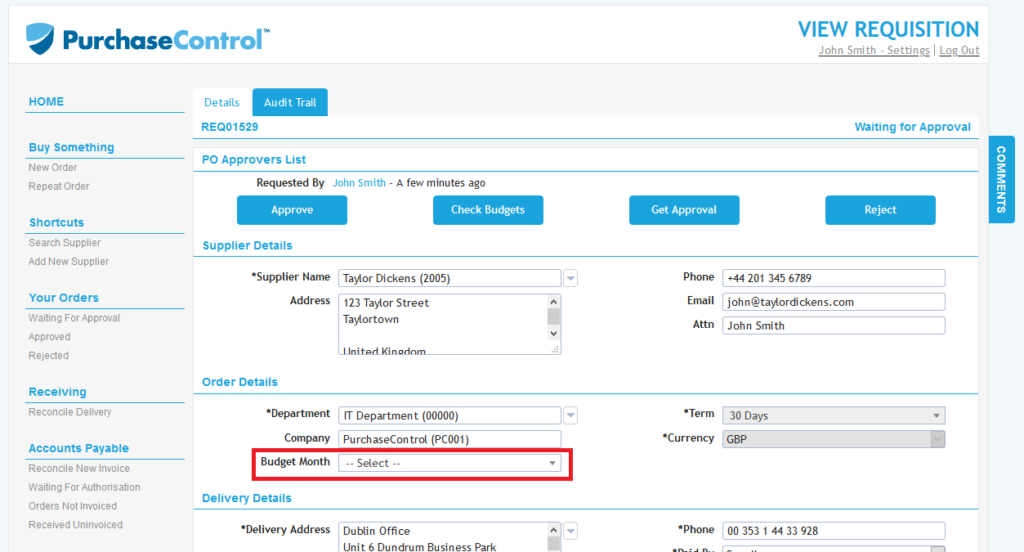
Assign PO Expenditure To A Previous Month
You can now backdate the assignment of the expenditure for a PO to a previous month when using Project or Annual budgets. Previously this was only possible when using monthly or multi-year budgets. You still have the ability to limit how many months into the past the expenditure can be assigned.
Custom Supplier and Item Fields Now Exportable
Custom fields added to the supplier and items in the system now have the option to be exportable fields. This should greatly improve the ability to report on your item catalogues and suppliers. This can help with compliance reports for supplier relationship management, for example, or any other supplier or item related reports.
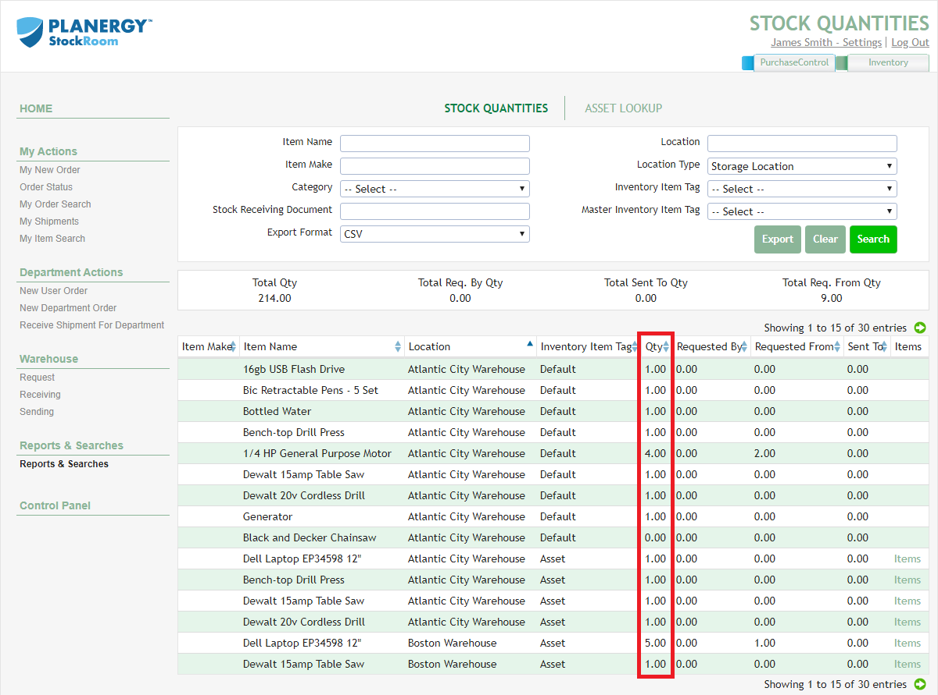
Inventory Stock Adjustment Import
You can now import bulk stock adjustments from a CSV or excel file speeding up the process of adjusting stock levels. Initially these bulk updates will be by request through support but in a future update the import functionality will be available within the system.
A full audit trail of stock adjustments carried out by file to ensure accountability and compliance. After the import stock quantities will be updated in bulk on the Stock Quantities report.
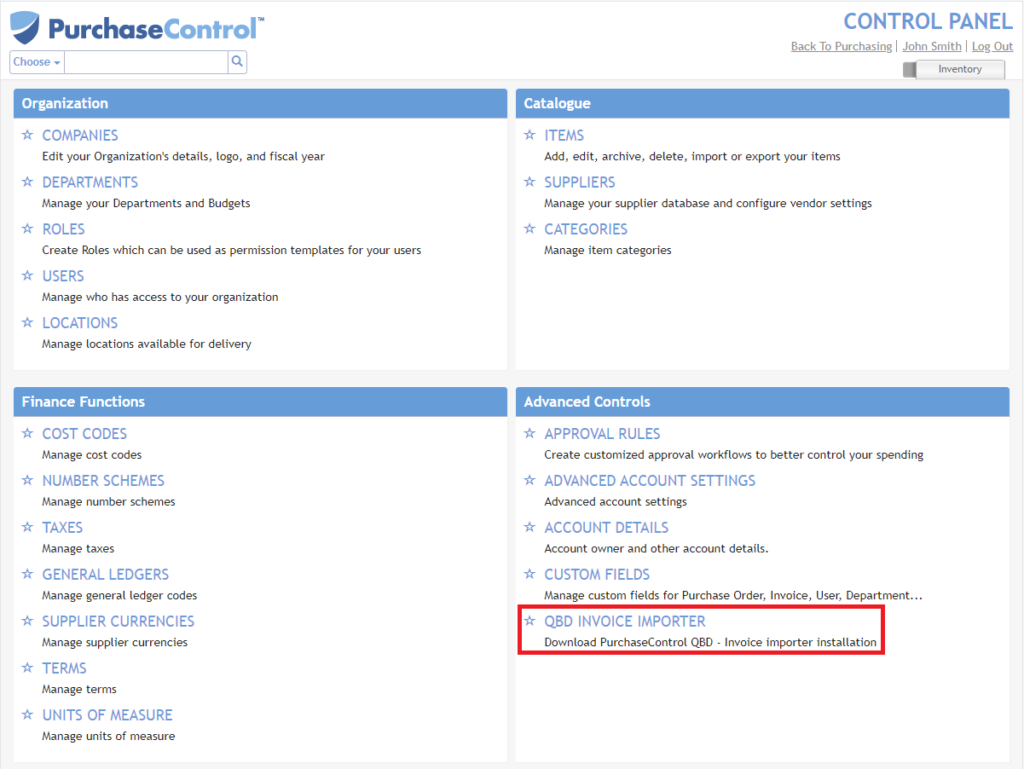
Quickbooks Desktop Integration Download
You can now download the integration for Quickbooks Desktop directly from the Control Panel if the integration is enabled on your account.
Other Improvements
- Improved first load times: We have improved javascript minification in the application to help improve the initial load time when you access for the first time.
- News feed notification: The home page news feed will now highlight when there is a new piece of news with a red notification bell.
- Bug fixes: A few fixes to reported issues including an issue in the Receiving search where using the back button did not return you to the search page with the same filtered results, an issue with some of the bar chart export to excel in Advanced Reporting,